|
|
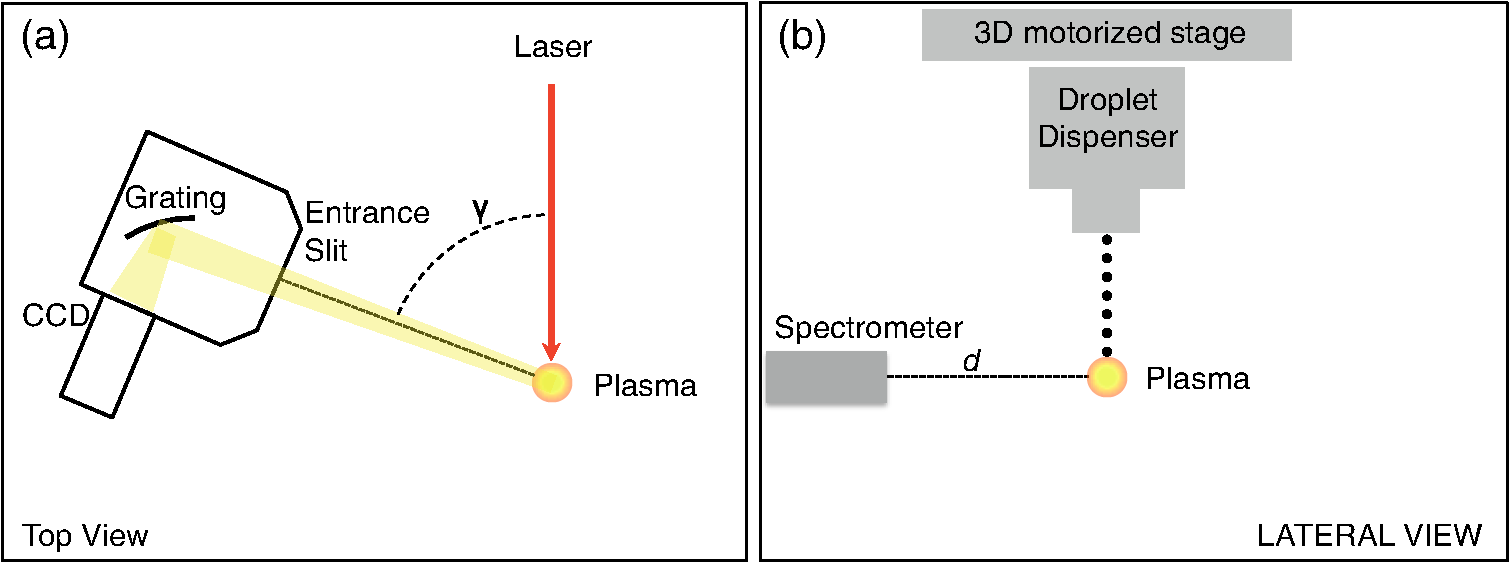
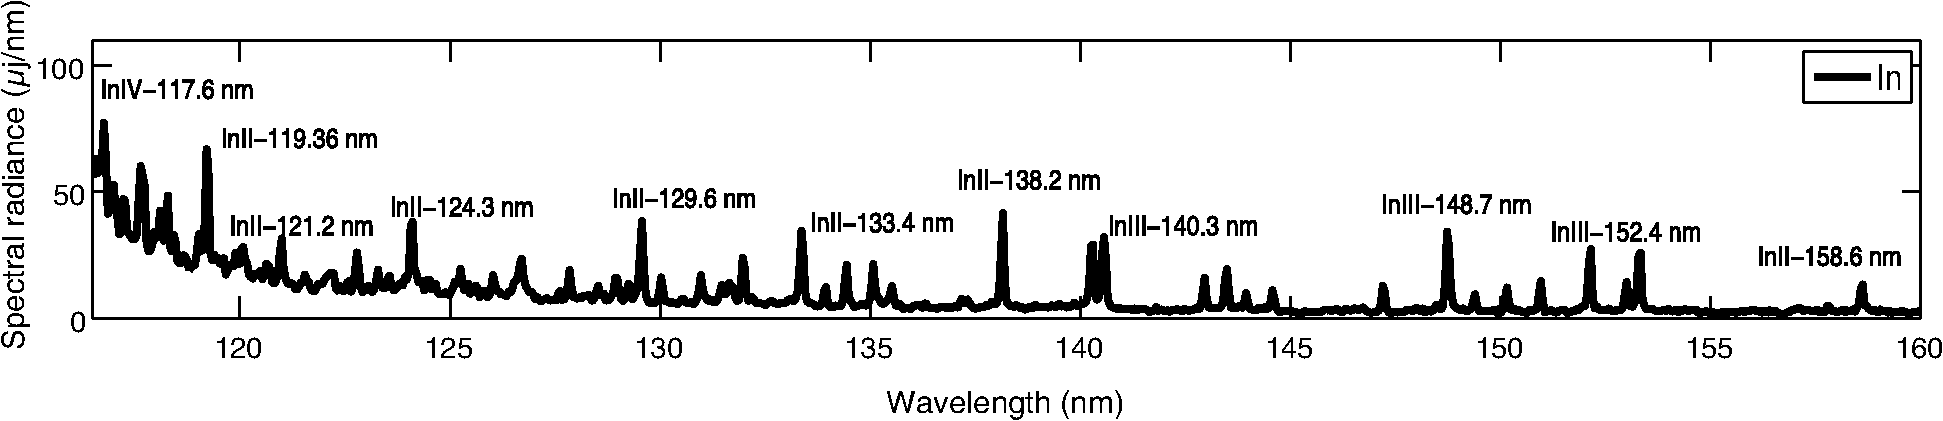
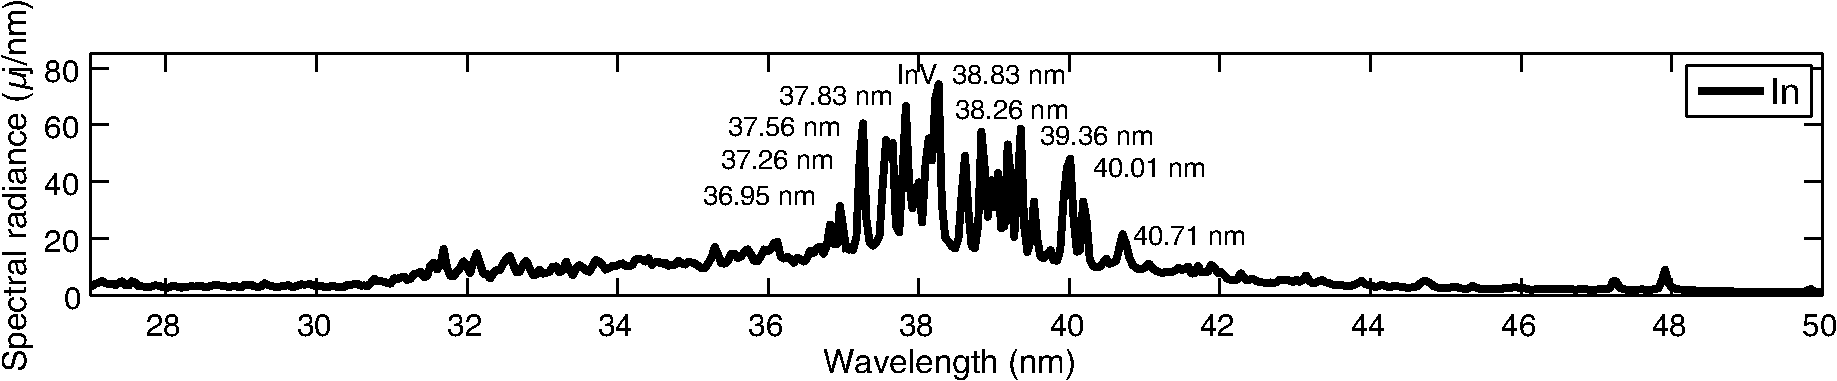
1.IntroductionInspection tools in the semiconducor industry are relevant for a wide range of processes, such as overlay measurements, critical dimension control, patterned and unpatterned wafer inspection, and mask inspection. Today, up to 50% of the fabrication process steps are devoted to inspection.1 With the advent of new lithography techniques such as extreme ultraviolet lithography (EUVL) that allow the manufacture of chip node sizes below 10 nm, inspection tools need to be upgraded in order to detect smaller defects on wafers. Sub-nanometer resolution can be achieved with tools such as atomic force microscopy or scanning electron microscopy inspection systems.1 These tools are extensively used for process development where sub-nm resolution is a priority. For the production line, where high throughput becomes essential, resolution sensitivity is currently larger than 20 nm. For particle detection on wafers, the needed throughput for production line is on the order of about 100–150 wafers per hour (wph) for unpatterned wafers and 30–50 wph for patterned wafers. In order to increase the throughput, inspection focuses on yield-limiting defects (i.e., defects of interest-DOI).2 Part of the inspection tools that are employed for particle detection are based on light scattering. These inspection tools use dark field and bright field systems with illuminations wavelengths from the visible range down to . Light scattering from particles is regulated by Mie’s theory. The intensity of scattered light can be described by the simplified formula of Rayleigh scattering when the illumination wavelength is much larger than the defect, approximated by a sphere of diameter . The scattered light intensity is proportional to .2 Therefore, one potential way to detect smaller defects on the wafers is to scale the illumination wavelength to the sub-200 nm range. The requirements in the deep ultraviolet range imply the need to detect defects in the regime.3 Numerical simulations show how the total cross section of scattered light versus the incident wavelength on a polystyrene particle (PSL) of 20 nm diameter has its maximum amplitude at normal incidence, between 50 and 100 nm.4 Droplet-based laser-produced plasma (LPP) light sources emit radiation from the EUV range to the visible range. Today, LPPs are the main source technology for EUVL scanners with droplet-based tin targets.5 Tin is the key element for efficient EUV emission at 13.5 nm.6 Micrometer-sized droplets allow to reduce the plasma debris generation, which consists of fast ion, neutrals, and droplet fragments. LPPs are also potential light sources for inspection applications such as actinic mask inspection (AIMS).7 Some advantages of LPPs for inspection applications are the high power availability (watts range), the high throughput (), the emission of incoherent light, and the very high brightness levels ().8 In addition to the EUV range, tin generates radiation emission from the UV region to the visible region. This part of the tin spectra is also relevant to estimate the absolute emission of out-of-band radiation.9,10 The multilayer optics used to reflect EUV are also reflective in other wavelength regions as, for example, in the UV region.6 UV radiation can cause flares, i.e., unwanted background exposure of the resist and reduction of image contrast. Alternative fuels to tin are gallium and indium. Gallium is used in the semiconductor industry for microwave preamplifiers, high-speed switching circuits, and infrared circuits. Gallium nitride and indium gallium nitride produce blue and violet light-emitting diodes and diode lasers. Gallium can be easily dispensed as droplets as it melts at almost room temperature (29.8°C) and has low toxicity. For sufficiently high laser power irradiances (from to ), laser generated gallium plasmas emit radiation from the water window to the visible region, covering the vacuum ultraviolet (VUV) region with several emission lines due to spontaneous emission and absorption processes. Of particular interest is the emission of gallium in the water window as a soft x-ray source.11 Indium has a melting point of 156.6°C, low toxicity, and a very similar atomic structure to tin. At the Laboratory for Energy Conversion, Ga and In droplet-based LPPs targets are already generated, demonstrating that both fuels are good candidates for LPP alternative fuels.12,13 Most of the spectral data on LPPs generated with Ga or In present in the literature have been carried out on planar targets and not on spherical targets. This is especially valid in the VUV range.14,15 In this paper, VUV emission spectra of Sn, Ga, and In are measured for the first time for droplet-based LPPs. The measurements were carried out with a VUV calibrated spectrometer operating from 30 to 180 nm. The obtained experimental results are promising for future wafer inspection tools development in the VUV range for dark field and bright field illuminations. 2.Theoretical ConsiderationsThe plasma atomic processes that lead to radiation emission in the VUV range include spontaneous emission from both high and low states of charges (on the order of ).16 Photoabsorption processes are also observed in this wavelength region with the use, for example, of the dual pulsed laser technique.17 Emission in this wavelength region occurs for planar targets within a few mm from the target.17 In this case, the plasma can be optically considered thin. Assuming a collisional-radiative equilibrium, the ion fractions (i.e., the ionic chain, which relates the fraction of the next ion stage to the observed one in the stationary case) as function of the electron temperature can be predicted by the Saha equation, once the ionization potential is known, with18,19 where is the collisional ionization coefficient, is the radiative recombination coefficient, and is the three-body recombination coefficient. These coefficients are given by the following equations:18 where is the ionization potential and is the number of open shell electrons corresponding to the state of charge .The different charge states or ion fractions, corresponding to a certain ionization potential as a function of the , can be calculated with numerical codes.20 These calculations are generally obtained for a fixed corresponding to the 90% of the critical density for a Nd:YAG operating at a wavelength of .21 Using this model, under the assumption of high electron densities, each electron temperature can be related to a certain laser pulse flux. In other words, once is known, the needed laser flux [] for a desired ion stage can be calculated with the following equation:21 where is the atomic number of the plasma element and is the incident laser wavelength in . This equation is derived from the collision radiative equilibrium model, which allows for the evaluation of the electron temperature and the mean charge state from the equivalences18Assuming a spot radius of , a pulse duration of 24 ns, a laser wavelength , and a repetition rate of 6 kHz, the minimum needed laser flux to yield emission of InV or GaV expected around 40 nm is in the range of .12,13 This laser flux is one order of magnitude lower with respect to the typical laser power used to produce EUV emission at 13.5 nm for tin.22 These emission results from ion transitions with charge states of to .6 3.System DescriptionThe Applied Laser Plasma Science (ALPS) II facility of the Laboratory for Energy Conversion, ETH Zürich is a soft x-ray source equipped with a high repetition rate Nd:YAG laser and a large capacity droplet dispenser generating droplet trains with frequencies up to 100 kHz. The Nd:YAG laser has an average power of up to 1.6 kW and operates at frequencies up to 20 kHz, at the fundamental wavelength of 1064 nm. The laser beam is focused into the vacuum chamber through a plano-convex lens to spot size diameters on the order of 50 to . The nominal peak irradiance is on the order of .23 The droplet dispenser is positioned at the laser focus position with a three-dimensional motorized motion system. The motion system is linked to a closed-loop control system able to compensate for droplet spatial instabilities (vertical and lateral instabilities). A real-time control system, able to detect the droplet target position in the horizontal and vertical planes, keeps the droplet at the focus position during continuous source operation. The spatial resolution achievable with the control system is of . The temporal resolution in the triggering mode is of . The closed-loop system also includes a fast integrator chip that records and integrates the EUV emission per pulse during continuous source operation mode.24 The facility is equipped with several debris mitigation systems in order to protect the optics and the sensors in the chamber from plasma debris deposition. The facility integrates several plasma diagnostics tools for radiation and particles detection. The charge particles emission from the plasma has been studied with multiple arrays of Langmuir probes (LPs) and electrostatic ion energy analyzers.25,26 The emitted radiation from the plasma is studied from the EUV regions with fast x-ray photodiodes to the visible region with different spectrographs. The VUV spectrometer used for this experiment is based on the Seya-Namioka rotational grating configuration.27 For this experiment, a holographic aberration corrected concave grating with is used. The linear dispersion is of . The spectral bandwidth is of 0.1 nm. Spectra are recorded from 30 to 180 nm. At the exit slit, a back-illuminated charge-coupled device (CCD) with is mounted, which allows to record in one spectrum a wavelength bandwidth of from the center wavelength. Images of the ALPS2 facility, the plasma emission, and the VUV spectrometer are shown in Figs. 1(a)–1(c), respectively. Fig. 1(a) Applied laser plasma science (ALPS) II facility, (b) plasma emission, (c) vacuum ultraviolet (VUV) spectrometer. 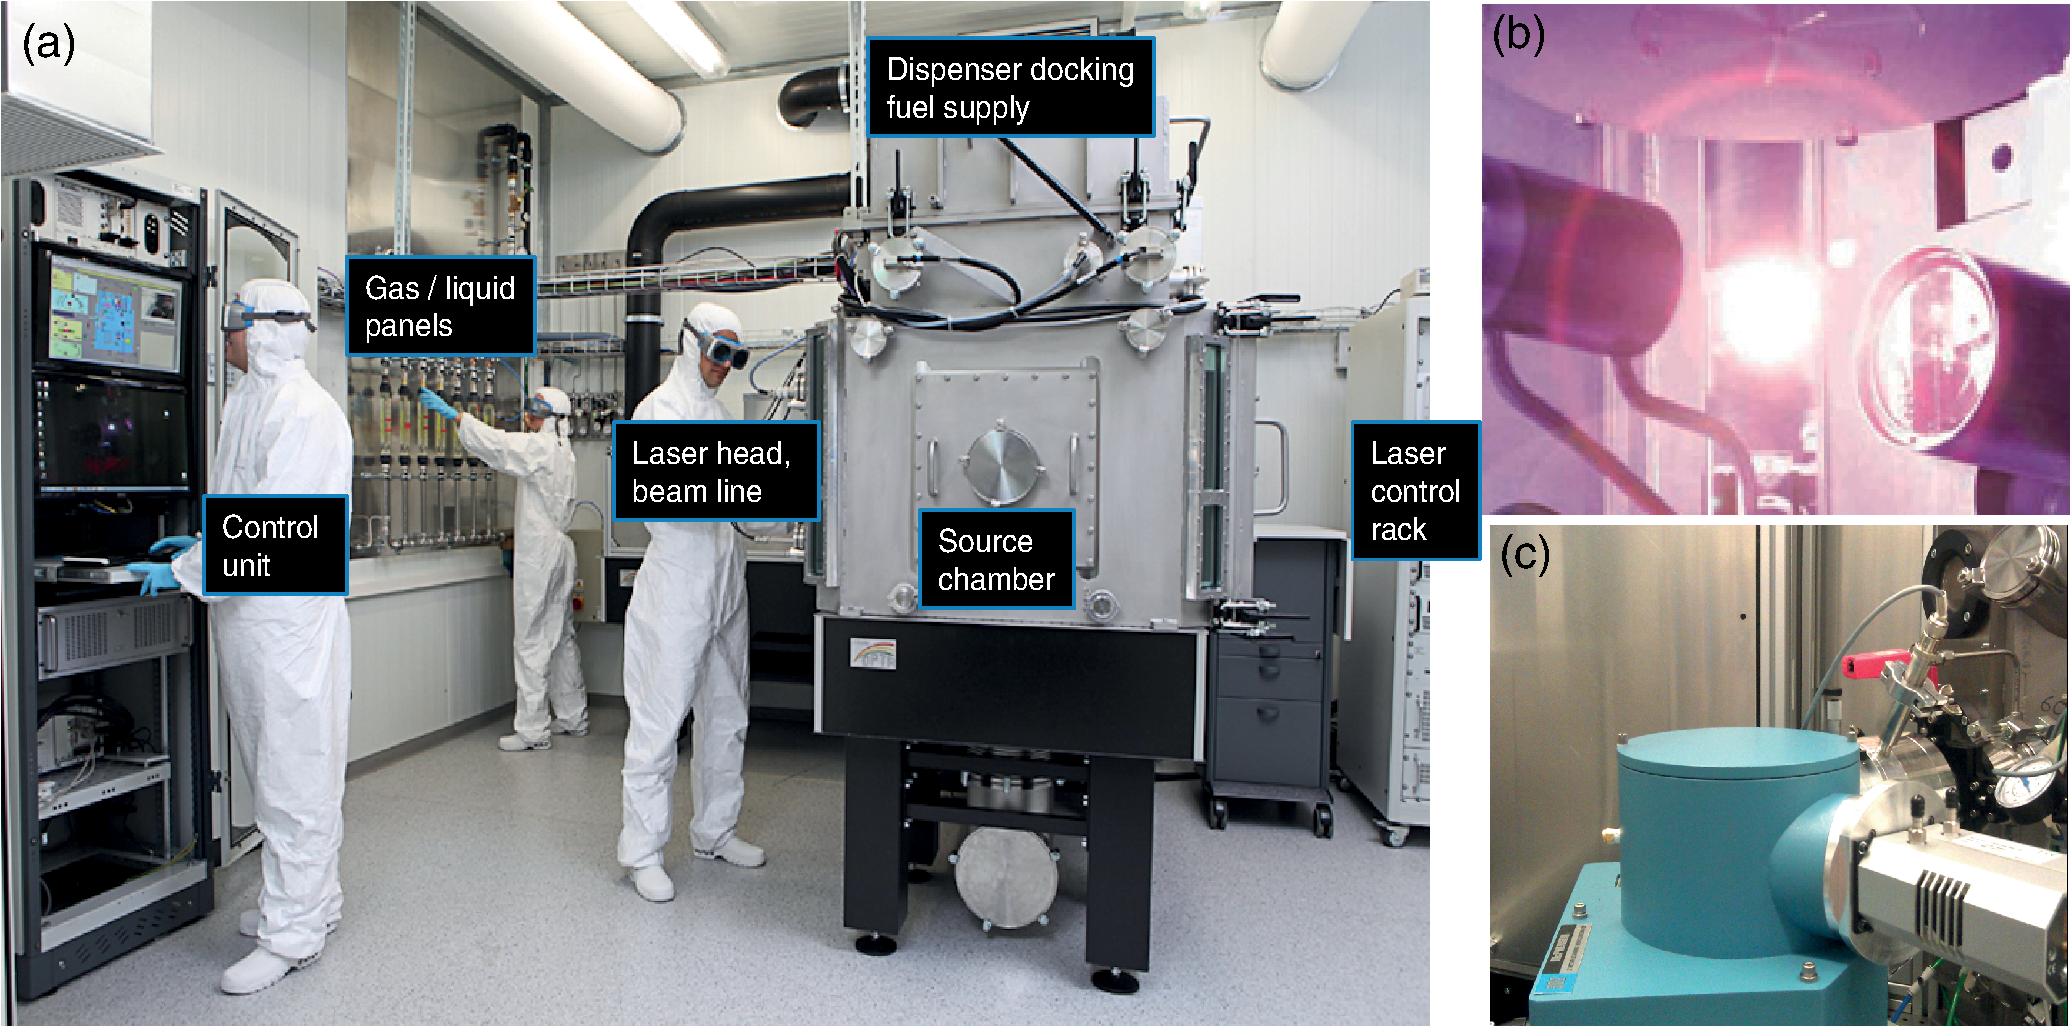 The nominal peak irradiance for each laser pulse is varied between , , and . The laser, which is operated in continuous pulsed mode, irradiates liquid Sn, Ga, and In droplets that are generated at 18 kHz with a diameter of . The source vacuum chamber is filled out with He and operates at different pressures varying between and . For sufficiently high laser irradiances, the EUV emission is also recorded with the VUV spectra to monitor the emission from the source with the use of an energy monitor described in detail in Ref. 22. The experimental setup is shown in Fig. 2. The spectrometer is placed at with respect to the laser beam direction at a distance from the plasma ignition point. The entrance slit width is fixed to . The spectral bandwidth is of 0.1 nm. Exposure times of the CCD are on the order of 100–400 ms. A calibrated deuterium lamp that is certificated from Physikalisch-Technische Bundesanstalt (PTB) in Berlin is used to calibrate the spectra in units of spectral radiance []. The deuterium lamp consists of a fused silica tube with a front end diameter of 127 mm and a total length of 167 mm. The distance between the lamp front end and the light source is of 81 mm. The front end of the lamp is sealed with an optical window. The synchrotron light from the BESSY II facility was used as the primary radiation source standard for the calibration of the lamp from 116 to 163 nm with a resolution of 0.2 nm. The spectral bandwidth is 0.8 nm full width at half maximum. Six additional PTB standard deuterium lamps were used to monitor the stability of the measurements over time during the calibration. After the lamp was calibrated, it was exposed to our VUV spectrometer system in order to measure the same spectrum from 116 to 163 nm in arbitrary units. A rectangular convolution function with a width equal to the spectral bandwidth of the spectrum from PTB was applied to our spectrum for correction of the different spectral bandwidths. By comparing the two spectra, a calibration curve is extracted. This curve is then used to measure the plasma spectra in units of spectral radiance. The same slit width and exposure time are used to acquire the spectra and the plasma spectra, while a correction for the different solid angles is applied. An extrapolation method is used to estimate the spectral radiance at smaller emission wavelengths, where no calibration is available, with the following equation:28 where are the photoelectrons/s (spectral count), is the spectral radiance in [], is the quantum efficiency of CCD, is the grating efficiency (including grating reflectivity), is the spectrometer geometrical etendue [] and is the spectral bandwidth in [nm]. Once the number of emitted of photons per 1 J (i.e., ), the CCD exposure time, and the laser repetition rate are known, the plasma spectral radiance emission per pulse can be calculated. The spectral radiance per pulse (or commonly called spectral energy density for LPPs) is then integrated in . Integration in is done considering that most of the VUV emission occurs in the half hemisphere of the forward plasma expansion direction, i.e., opposite to the main laser beam direction.22 The emission lines at the different wavelengths are compared to tabulated values reported by the National Institute of Standards and Technology (NIST).124.Experimental Results and DiscussionAn example of a Ga droplet train generated with the laboratory for energy conversion droplet dispenser is shown in Fig. 3(a). In Fig. 3(b), the corresponding droplet trace in the plane is shown. The droplet trace has a standard deviation of , due to the closed-loop control system that allows to keep the droplet train aligned to the main laser focus position. This point corresponds to the plasma ignition position. Fig. 3(a) Ga droplet trace generated at 23 kHz, (b) droplet trace in the direction versus time, (c) detail of x trace in milliseconds within a 1 s time window. 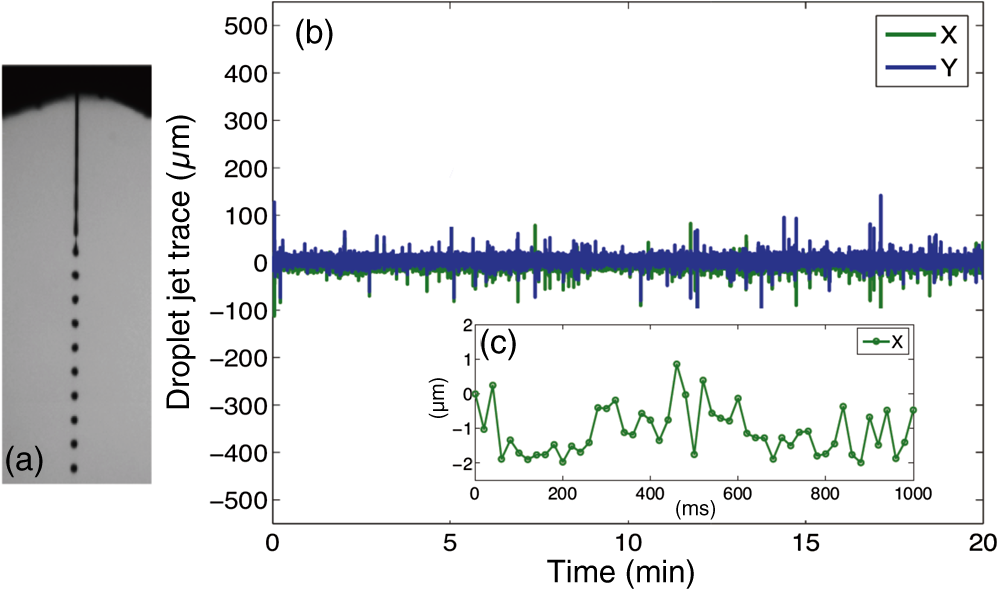 In Fig. 4, the plasma emission spectra from 30 to 180 nm for different fuels are shown. The three spectra are taken under the exact same experimental conditions and normalized to the maximum emission line intensity. These spectra were obtained in He ambient gas at 0.1 mbar for a laser irradiance of . One can observe the presence of several emission lines. From a comparison with the tabulated atomic NIST emission lines, the most abundant charge states that were observed in this wavelength region are between . Most of the emission lines are characteristics of the specific fuel. In this wavelength region, no evident line emission due to the ionization of the background gas is observed. Therefore, the spectra can be spectrally considered pure. Around 40 nm, Ga presents one evident emission line at 42.3 nm due to the GaIV ion transitions levels . Indium has several emission lines around 40 nm due to InV ion transitions. These lines form a sort of “broadband” emission that is analyzed more in detail in Fig. 6. Sn has two sharp emission lines at 35.51 and 36.10 nm due to SnV ion transitions. In the wavelength region around 30 nm, smaller peak emissions are also detected. These are due to the contribution of charge states up to SnVII.29 At 50 nm, a sharp increase in continuum contribution under the emission lines is observed. This is due to the He gas transmission property that at 50 nm has a sharp increase to 100% photon transmission in our experimental vacuum conditions.30 Around 100 nm, the contribution due to continuum emission decreases. Here, several characteristic lines are observed for all the fuels mainly due to ion transitions involving lower charge states between . However, the line emissions still involve ion transitions due to higher charge states. This is particular evident for the Ga ion transitions, as reported in the literature.31 After 160 nm, no line emission is still visible as the number of photons reaching the detector is too low. For this wavelength region, larger slit widths would be needed to increase the throughput of the optical system. Fig. 4Emission spectra of the three fuels, gallium, indium, and tin in the VUV region from 30 to 160 nm. 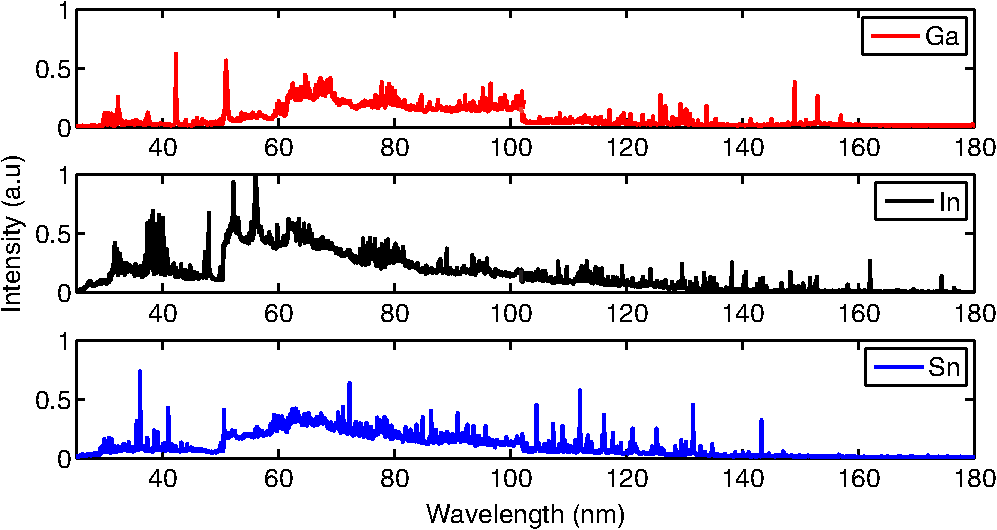 Indium is analyzed in detail in two wavelength regions, namely between 117 and 160 nm and between 30 and 50 nm. The results are reported in Figs. 5 and 6. In both figures, the spectra are calibrated in terms of spectral radiance, integrated , and calculated for one pulse as described in previous section. By analyzing the main spectral lines in Fig. 5, one can observe that the emission around 140 nm center wavelength consists charge states ranging from InII to InIV (i.e., ). The absolute values of energy are on the order of . Similar spectral radiances are also obtained for tin and gallium. These experimental results are comparable to similar experimental measurements reported in the literature at similar laser irradiances on sphere targets with a 0.1 to thick tin coating.10 In this setup, however, the spectral lines are resolved with much lower resolution. In Fig. 6, the emission around the 40-nm center wavelength is shown. These detected spectral lines are due to InV () ion transitions. As previously mentioned, these lines form a sort of “broadband” emission that can be useful for future bright and dark field illumination inspection tools that operate with smaller wavelengths light sources. In Figs. 7(a) and 7(b), the indium spectra are respectively shown for two different He pressure levels at fixed irradiance of and for two different laser irradiances for a fixed He pressure of 0.1 mbar. One can observe from these figures that the higher the pressure level the less intense are the emission lines as the radiation is absorbed by the background gas. At the same time, higher irradiances lead to more intense emission lines due to the additional laser energy. Fig. 7Absolute energy emission spectra of indium around 140 nm measured (a) for two background pressure levels for a fixed laser irradiance of and (b) for two laser irradiances at fixed pressure level of 0.1 mbar. 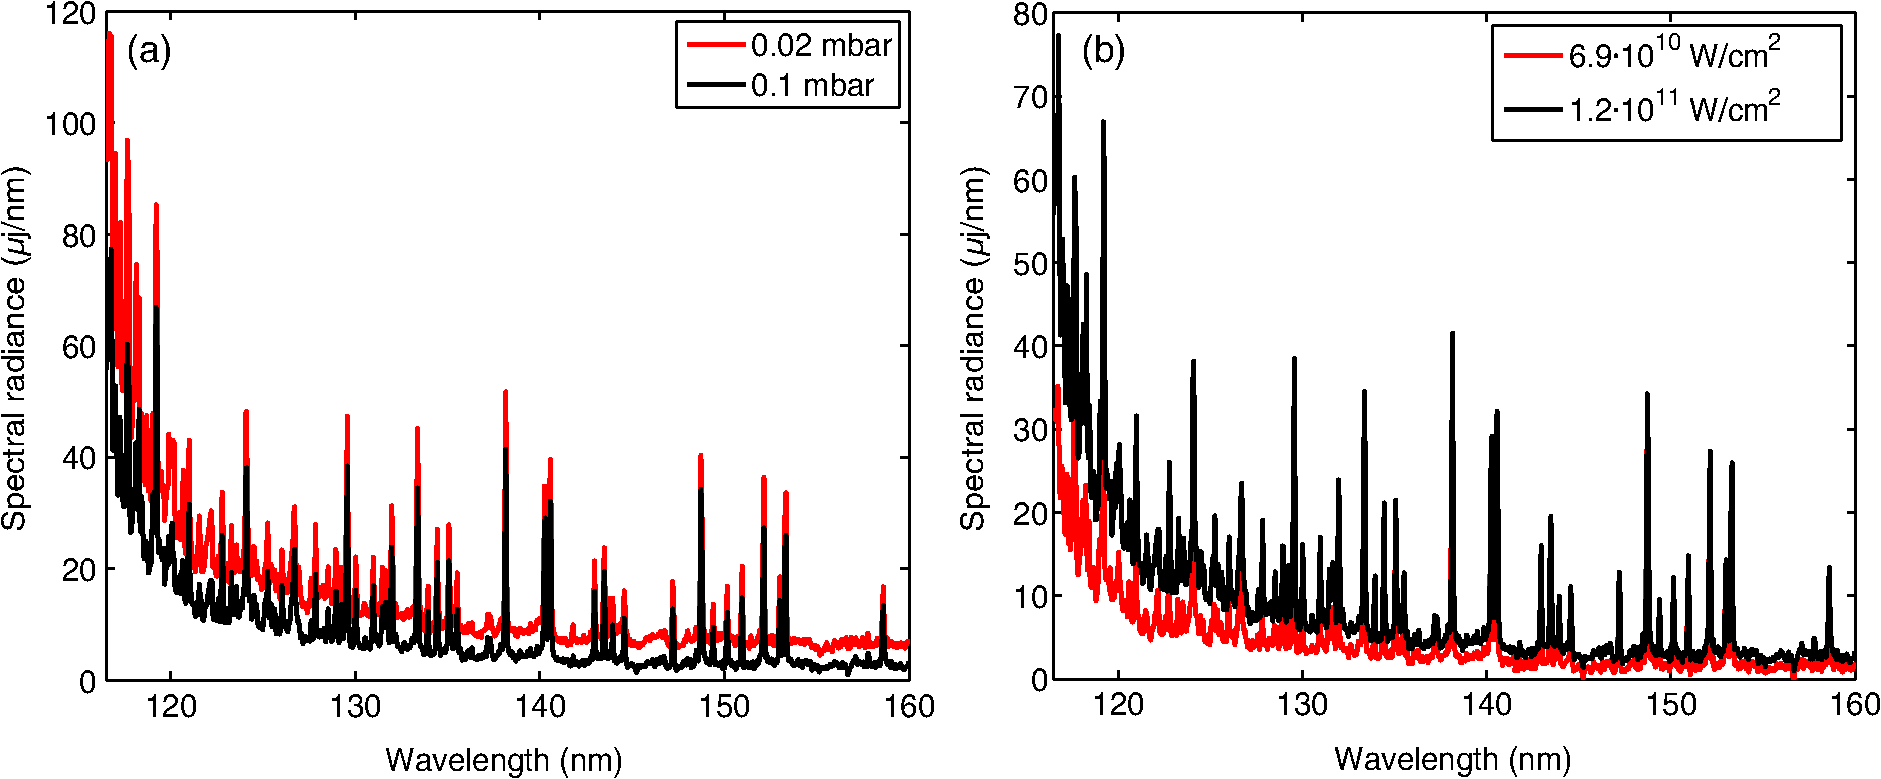 In order to estimate the overall output power from the LPP source in the VUV range, the calibrated spectra are integrated over the emission wavelength bands as a function of the pressure level and as a function of the input laser power. Two different wavelength bands are considered, namely 30–100 nm and 100–180 nm. In Fig. 8(a), the integrated plasma power versus the He background gas level is shown. For 0.02 mbar, integrated plasma powers on the order of 5–7 W can be achieved in the two analyzed wavelength regions. At 0.3 mbar, the integrated powers decrease to 1.5–3 W. As expected, the higher the background gas pressure level, the lower the output power from the plasma source for both wavelength regions. As already mentioned above, the line intensity decreases with increasing background gas level due to absorption processes and possible ionization of the background gas. It is interesting to observe that in the wavelength region between 100 and 180 nm, an increase in power is observed at 0.3 mbar. Fig. 8Integrated plasma power for three different wavelength regions (a) versus background pressure level for a fixed laser irradiance of and (b) versus laser input power at the droplet at 0.1 mbar background pressure. 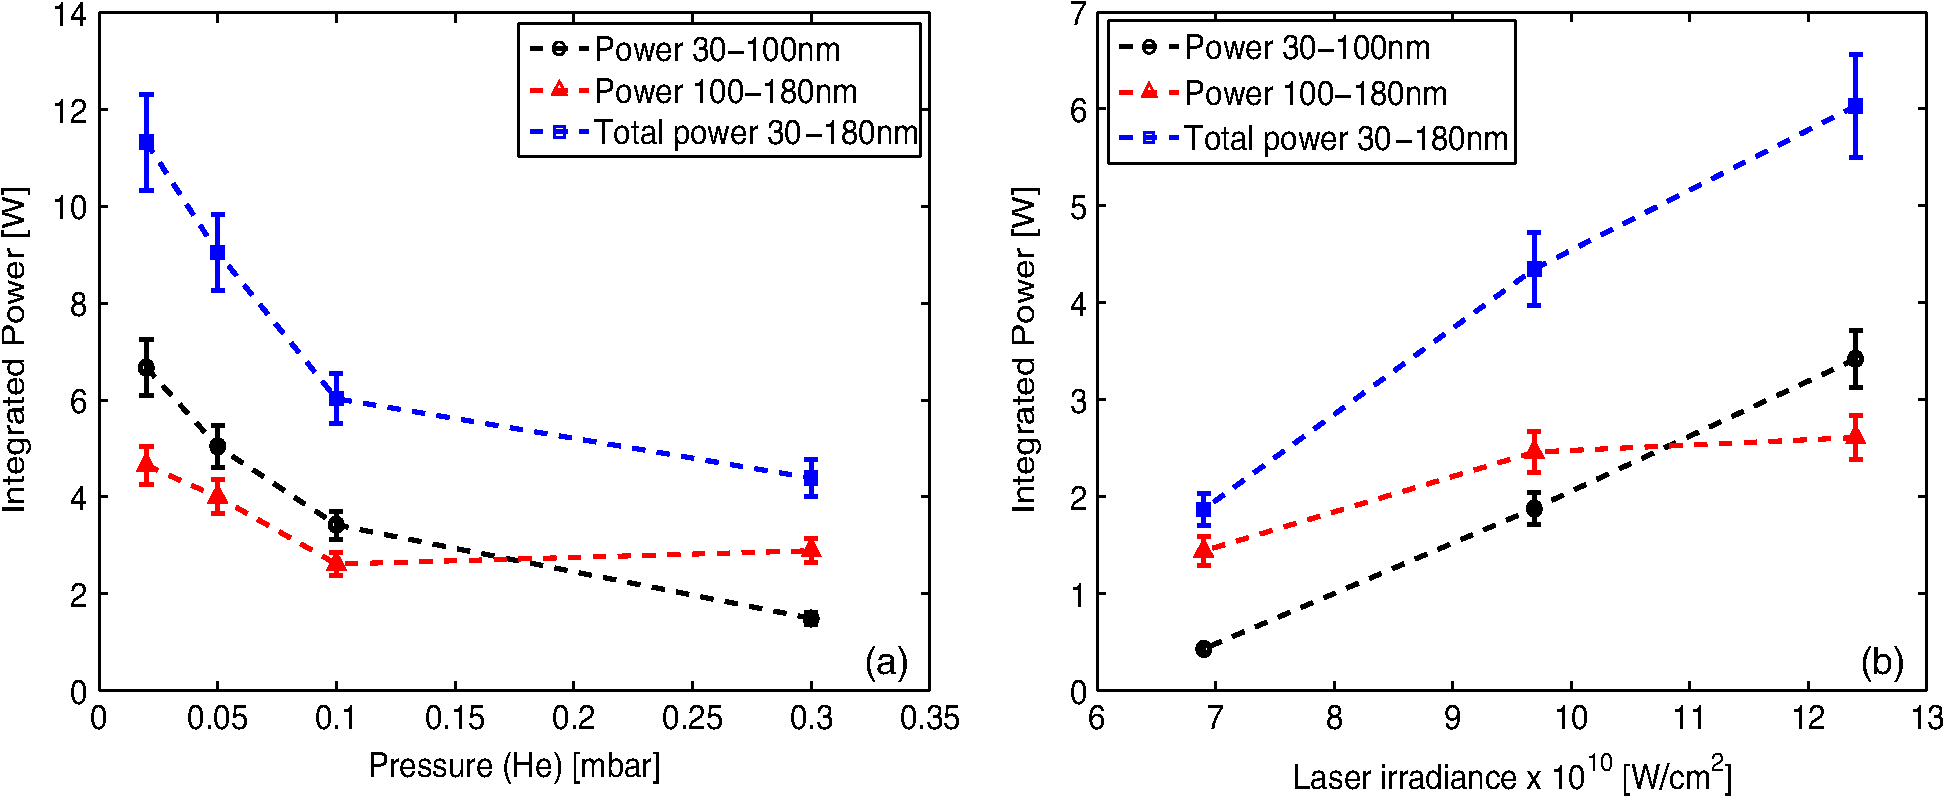 In this wavelength region, the neutral species InI and especially the single ionized species InII are dominant with respect to the higher charge states. With increasing background gas pressure, recombination effects and collisions within the plasma due to plume compression lead to an increase of the neutral and singly ionized species emission. This explains the higher power values observed from 100 to 180 nm at 0.3 mbar. Similar spectra were observed as a function of background gas level by other authors for a Cu laser-produced plasma in the wavelength range between 400 and 500 nm.32 In Fig. 8(b), the integrated plasma power versus the laser irradiance is shown for a fixed pressure of 0.1 mbar. In the entire emission wavelength region (from 30 to 180 nm), we obtain plasma power values ranging from 2 to 6 W. From these output powers, the conversion efficiency (CE) can be calculated, i.e., the ratio of the integrated plasma emission over the laser input power. The achievable CE values are on the order of 1%–1.9% in the full range of wavelengths from 30 to 180 nm with an optimum value at intermediate laser irradiances . Therefore, the highest conversion efficiency is obtained for lower laser irradiance levels, as predicted by the theoretical model described in Sec. 2, with respect to the irradiance levels that are required to produce EUV. The presented data are specific for the employed laser and could be scaled through the laser repetition rate. In Table 1, a summary of the estimated power levels for at 0.1 mbar and for is reported for the three fuels in the three analyzed wavelength bandwidths. As one can observe, the highest power output is obtained with indium, especially in the smaller wavelength region. Between 100 and 180 nm, all the three fuels show comparable total integrated power values. Table 1Integrated power calculated for the different fuels in different wavelength ranges.
5.ConclusionsIn this paper, gallium, indium, and tin spectra are measured for the first time in the VUV region from 30 to 180 nm on droplet-based LPPs. Calibrated spectra are measured both in wavelength and spectral radiance emission units. Several line emissions are detected due to ion transitions with states of charges between . The total achievable output power in continuous source operating conditions is on the order of 2–6 W. This power availability makes the LPP source viable for wafer inspection and metrology applications. A feasibility study was also performed to verify whether an inspection system based on these experimental data could provide adequate power for a combined bright and dark field wafer inspection system. These studies indicated that the achievable defect resolution is on the order of 5–7 nm within the high volume production of 120 to 150 wph. Therefore, the knowhow for the EUV droplet-based LPP source could be potentially used for future light sources with emission in the VUV range for the development of wafer inspection systems. The physical processes driving the formation and expansion of the laser plasma are complex and related to a large range of time and length scales (nanometer to micrometer scale). Future work will be focused on time and spatial resolved measurements to understand how the different line emissions are influenced by the plasma temporal and spatial dynamics. AcknowledgmentsThe authors would like to thank the previous ALPS members Mr. Konrad Hertig for his support during the installation of the spectrometer in ALPS2 and Dr. Oran Morris that was funded from the Swiss National Science Foundation (SNF) for the VUV spectrometer and the SNF for the R’Equip Grant No. 2-77592-12. ReferencesE. Solecky et al.,
“In-line E-beam wafer metrology and defect inspection: the end of an era for image-based critical dimensional metrology? New life for defect inspection,”
Proc. SPIE, 8681 86810D
(2013). http://dx.doi.org/10.1117/12.2010007 PSISDG 0277-786X Google Scholar
S. Stokowski and M. Vaez-Iravani,
“Wafer inspection technology challenges for ULSI manufacturing,”
Proc. AIP, 449 405
–415
(1998). http://dx.doi.org/10.1063/1.56824 Google Scholar
T. Crimmins,
“Defect metrology challenges at the 11 nm node and beyond,”
Proc. SPIE, 7638 76380H
(2010). http://dx.doi.org/10.1117/12.846623 PSISDG 0277-786X Google Scholar
D. B. Buckner and D. Hirleman,
“Deep-ultraviolet scatterometry for nanoparticle detection,”
Proc. SPIE, 4182 231
–241
(2000). http://dx.doi.org/10.1117/12.410083 PSISDG 0277-786X Google Scholar
I. V. Fomenkov et al.,
“Laser produced plasma light source development for HVM,”
Proc. SPIE, 9048 904835
(2014). http://dx.doi.org/10.1117/12.2048195 PSISDG 0277-786X Google Scholar
V. Bakshi, EUV Sources for Lithography, SPIE Press, Bellingham, WA
(2006). Google Scholar
B. Rollinger et al.,
“Clean and stable LPP light source for HVM inspection applications,”
Proc. SPIE, 9048 90482K
(2014). http://dx.doi.org/10.1117/12.2046416 PSISDG 0277-786X Google Scholar
P. Choi et al.,
“High-radiance extreme-ultraviolet light source for actinic inspection and metrology,”
J. Micro/Nanolith. MEMS MOEMS, 11
(2), 021107
(2012). http://dx.doi.org/10.1117/1.JMM.11.2.021107 Google Scholar
O. Morris et al.,
“Angle-resolved absolute out-of-band radiation studies of a tin-based laser-produced plasma source,”
App. Phys. Lett., 91 081506
(2007). http://dx.doi.org/10.1063/1.2769940 APPLAB 0003-6951 Google Scholar
H. Sakaguchi et al.,
“Absolute evaluation of out-of-band radiation from laser-produced tin plasmas for extreme ultraviolet lithography,”
Appl. Phys. Lett., 92 111503
(2008). http://dx.doi.org/10.1063/1.2901875 APPLAB 0003-6951 Google Scholar
T. Dohring et al.,
“Soft x-ray spectrum of a laser-produced gallium plasma,”
J. Phys. B., 27 L663
(1994). http://dx.doi.org/10.1088/0953-4075/27/19/002 Google Scholar
E. Kochman,
“Next generation EUV fuel for the LEC laser plasma source,”
ETH Zürich,
(2012). Google Scholar
S. Badertscher,
“Next generation fuels for the LEC extreme ultraviolet source,”
ETH Zürich,
(2011). Google Scholar
A. K. Shuaibov et al.,
“Optical characteristics of a gallium laser plasma,”
Plasma Phys. Rep., 27
(1), 82
–85
(2001). http://dx.doi.org/10.1134/1.1339488 PPHREM 1063-780X Google Scholar
G. Duffy and P. Dunne,
“The photoabsorption spectrum of an indium laser produced plasma,”
J. Phys. B, 34 L173
(2001). http://dx.doi.org/10.1088/0953-4075/34/6/104 Google Scholar
X. Jiang et al.,
“Double-pulse laser induced breakdown spectroscopy with ambient gas in the vacuum ultraviolet: optimization of parameters for detection of carbon and sulfur in steel,”
Spectrochim. Acta Part B, 101 106
–113
(2014). http://dx.doi.org/10.1016/j.sab.2014.07.002 Google Scholar
D. Colombant and G. F. Tonon,
“X‐ray emission in laser‐produced plasmas,”
J. App. Phys., 44 3524
–3537
(1973). http://dx.doi.org/10.1063/1.1662796 Google Scholar
G. Gupta and B. Sinha,
“Effect of ionization and recombination coefficients on the charge-state distribution of ions in laser-produced aluminum plasmas,”
Phys. Rev. E, 56
(2), 2104
(1997). http://dx.doi.org/10.1103/PhysRevE.56.2104 Google Scholar
R. Cowan,
“The theory of atomic structure and spectra,”
Los Alamos Series in Basic Applied Sciences,
(1981). Google Scholar
O. Morris,
“Angle-resolved studies of tin laser plasma extreme ultraviolet sources,”
Univ. of College Dublin,
(2008). Google Scholar
A. Z. Giovannini and R. S. Abhari,
“Effects of the dynamics of droplet-based laser-produced plasma on angular extreme ultraviolet emission profile,”
Appl. Phys. Lett., 104 194104
(2014). http://dx.doi.org/10.1063/1.4878506 APPLAB 0003-6951 Google Scholar
R. Abhari et al.,
“Laser-produced plasma light source for extreme-ultraviolet lithography applications,”
J. Micro/Nanolith. MEMS MOEMS, 11
(2), 021114
(2012). http://dx.doi.org/10.1117/1.JMM.11.2.021114 Google Scholar
N. Gambino et al.,
“A hemispherical Langmuir probe array detector for angular resolved measurements on droplet-based laser-produced plasmas,”
Rev. Sci. Instrum., 85
(9), 093302
(2014). http://dx.doi.org/10.1063/1.4894676 RSINAK 0034-6748 Google Scholar
A. Z. Giovannini et al.,
“Angular ion species distribution in droplet-based laser-produced plasmas,”
J. Appl. Phys., 117
(3), 033302
(2015). http://dx.doi.org/10.1063/1.4906277 JAPIAU 0021-8979 Google Scholar
T. Namioka,
“Theory of the concave grating. III. Seya-Namioka monochromator,”
J. Opt. Soc. Am., 49
(10), 951
–959
(1959). http://dx.doi.org/10.1364/JOSA.49.000951 JOSAAH 0030-3941 Google Scholar
D. H. Tracy and S. A. Myers,
“Absolute spectral radiance of 27 MHz inductively coupled argon plasma background emission,”
Spectrochim. Acta, 37B 1055
–1068
(1982). http://dx.doi.org/10.1016/0584-8547(82)80035-9 Google Scholar
H. Ohashi et al.,
“EUV emission spectra in collisions of multiply charged Sn ions with He and Xe,”
J. Phys. B, 43 065204
(2010). http://dx.doi.org/10.1088/0953-4075/43/6/065204 Google Scholar
T. Shirai et al.,
“Spectral data for gallium: Ga I through Ga XXXI,”
J. Phys. Chem. Ref. Data, 36 509
–615
(2007). http://dx.doi.org/10.1063/1.2207144 Google Scholar
S. S. Harilal et al.,
“Background gas collisional effects on expanding fs and ns laser ablation plumes,”
Appl. Phys. A, 117
(1), 319
–326
(2014). http://dx.doi.org/10.1007/s00339-014-8268-8 Google Scholar
BiographyNadia Gambino has been senior researcher at the Laboratory for Energy Conversion, ETH Zurich, since 2011. She completed her MSc at the Physics Faculty of the University in Catania in Italy in 2007. She received her PhD from the Engineering Physics Department of Catania in Italy in 2011. Her research focuses on plasma physics, plasma diagnostics, and laser produced plasma sources for multidisciplinary purposes such as nuclear astrophysics, energy production, and material science (EUV light sources). Bob Rollinger is senior researcher at the Laboratory for Energy Conversion, ETH Zurich. He completed his MSc at ETH in 2006, with a focus on aerothermodynamics and thermotronics. He received his PhD from ETH in 2012 for his thesis “Droplet Target for Laser-produced Plasma Light Sources.” His experimental research covers droplet generation, debris mitigation, optics, and lasers for EUV sources. His theoretical interests include modeling of laser-droplet interactions and plasma formation in EUV sources. Duane Hudgins has been a PhD student at the Applied Laser Plasma Science (ALPS) facility in the Laboratory for Energy Conversion, ETH Zurich, since 2013. He completed his MS degree in mechanical engineering at Massachusetts Institute of Technology in 2008, with a focus on premixed combustion dynamics. He has 5 years of industry experience, having held a position as a thermodynamics engineer at ALSTOM and a project manager at ABB. Reza S. Abhari is professor of energy technologies at ETH Zurich, Switzerland, and the head of its Laboratory for Energy Conversion. He is a member of the Swiss National Academy of Engineering Sciences, a fellow of ASME, and the recipient of many scientific awards. He is the author/co-author of over 250 scientific articles and journal publications in areas such as plasma dynamics, light sources, sensors and actuators, energy system components, and energy system modeling. |